Standardized Work Chart
The chart posted at the work area — showing the layout, work sequence, standard work-in-process, quality checks, and safety points — and used by leaders to compare the standard with what is actually happening.
The Standardized Work Chart is the third of the three major forms, and the one that lives at the gemba. It is not just an operator instruction. It is a visual control and management tool that summarizes the work pattern in the actual work area, so leaders and team members can compare what is supposed to happen with what is happening.
1What the chart is for
The Standardized Work Chart pulls together information from the other forms and shows it on the actual work-area layout. In a single view it carries the three elements of standardized work — takt time, work sequence, and standard work-in-process — placed where they physically occur.
It serves two audiences. For leaders and managers it is a visual control tool: by checking the work site against the chart, they catch problems that would otherwise go unnoticed, and it becomes a basis for daily management and continuous improvement. For team members it is a reference for the content of their job, especially the three elements. Either way it should be posted at the work area, where it can be used — not filed in a binder.
A stale standardized work chart can be worse than no chart, because it teaches people that posted standards are not serious.
2What a complete chart contains
A complete Standardized Work Chart includes:
- area and process, and the product or part;
- takt time and cycle time;
- the work-area layout;
- the numbered work sequence, with the return path to the start;
- standard work-in-process (SWIP) at its required points;
- quality check points and safety points;
- approval and revision information.
Cycle time here is the time for one team member to complete one full cycle of their work range — the total of manual work, walking, and any waiting — taken straight from the Combination Table. Comparing cycle time against takt is the chart's first health check.
3The chart is built last
The chart should not be made first. It is the output of the analysis in the previous sections — built after you have:
- observed the actual work;
- understood the work elements and times;
- prepared the Process Capacity Sheet where machine capacity matters;
- created the Combination Table;
- decided the work sequence and the standard work-in-process.
4Reading the chart
The chart uses a small set of symbols to map the work onto the actual layout. Once you can read them, a posted chart tells you the whole work pattern at a glance:
A few of these conventions carry real meaning:
- the work-sequence numbers are joined by a solid line; a dashed arrow is used only for the return from the last step back to the first;
- SWIP is marked where a piece comes to rest after machine processing and conveyance; for more than one piece, the symbol is followed by “× n”;
- a safety cross marks processes needing a precaution — as a rule, the automatic machines;
- the layout is drawn roughly to real proportions, and the least-capable machine is distinguished by hatching, tying the chart back to the constraint found on the Process Capacity Sheet.
Below is the completed chart for the intake-manifold example, the original training form. Reading it, the numbered sequence runs 1 → 6 around the cell, the machines sit in their physical positions, SWIP and quality and safety symbols mark where they apply, and the return path closes the loop back to step 1 — all at a takt and cycle time of 30 seconds.
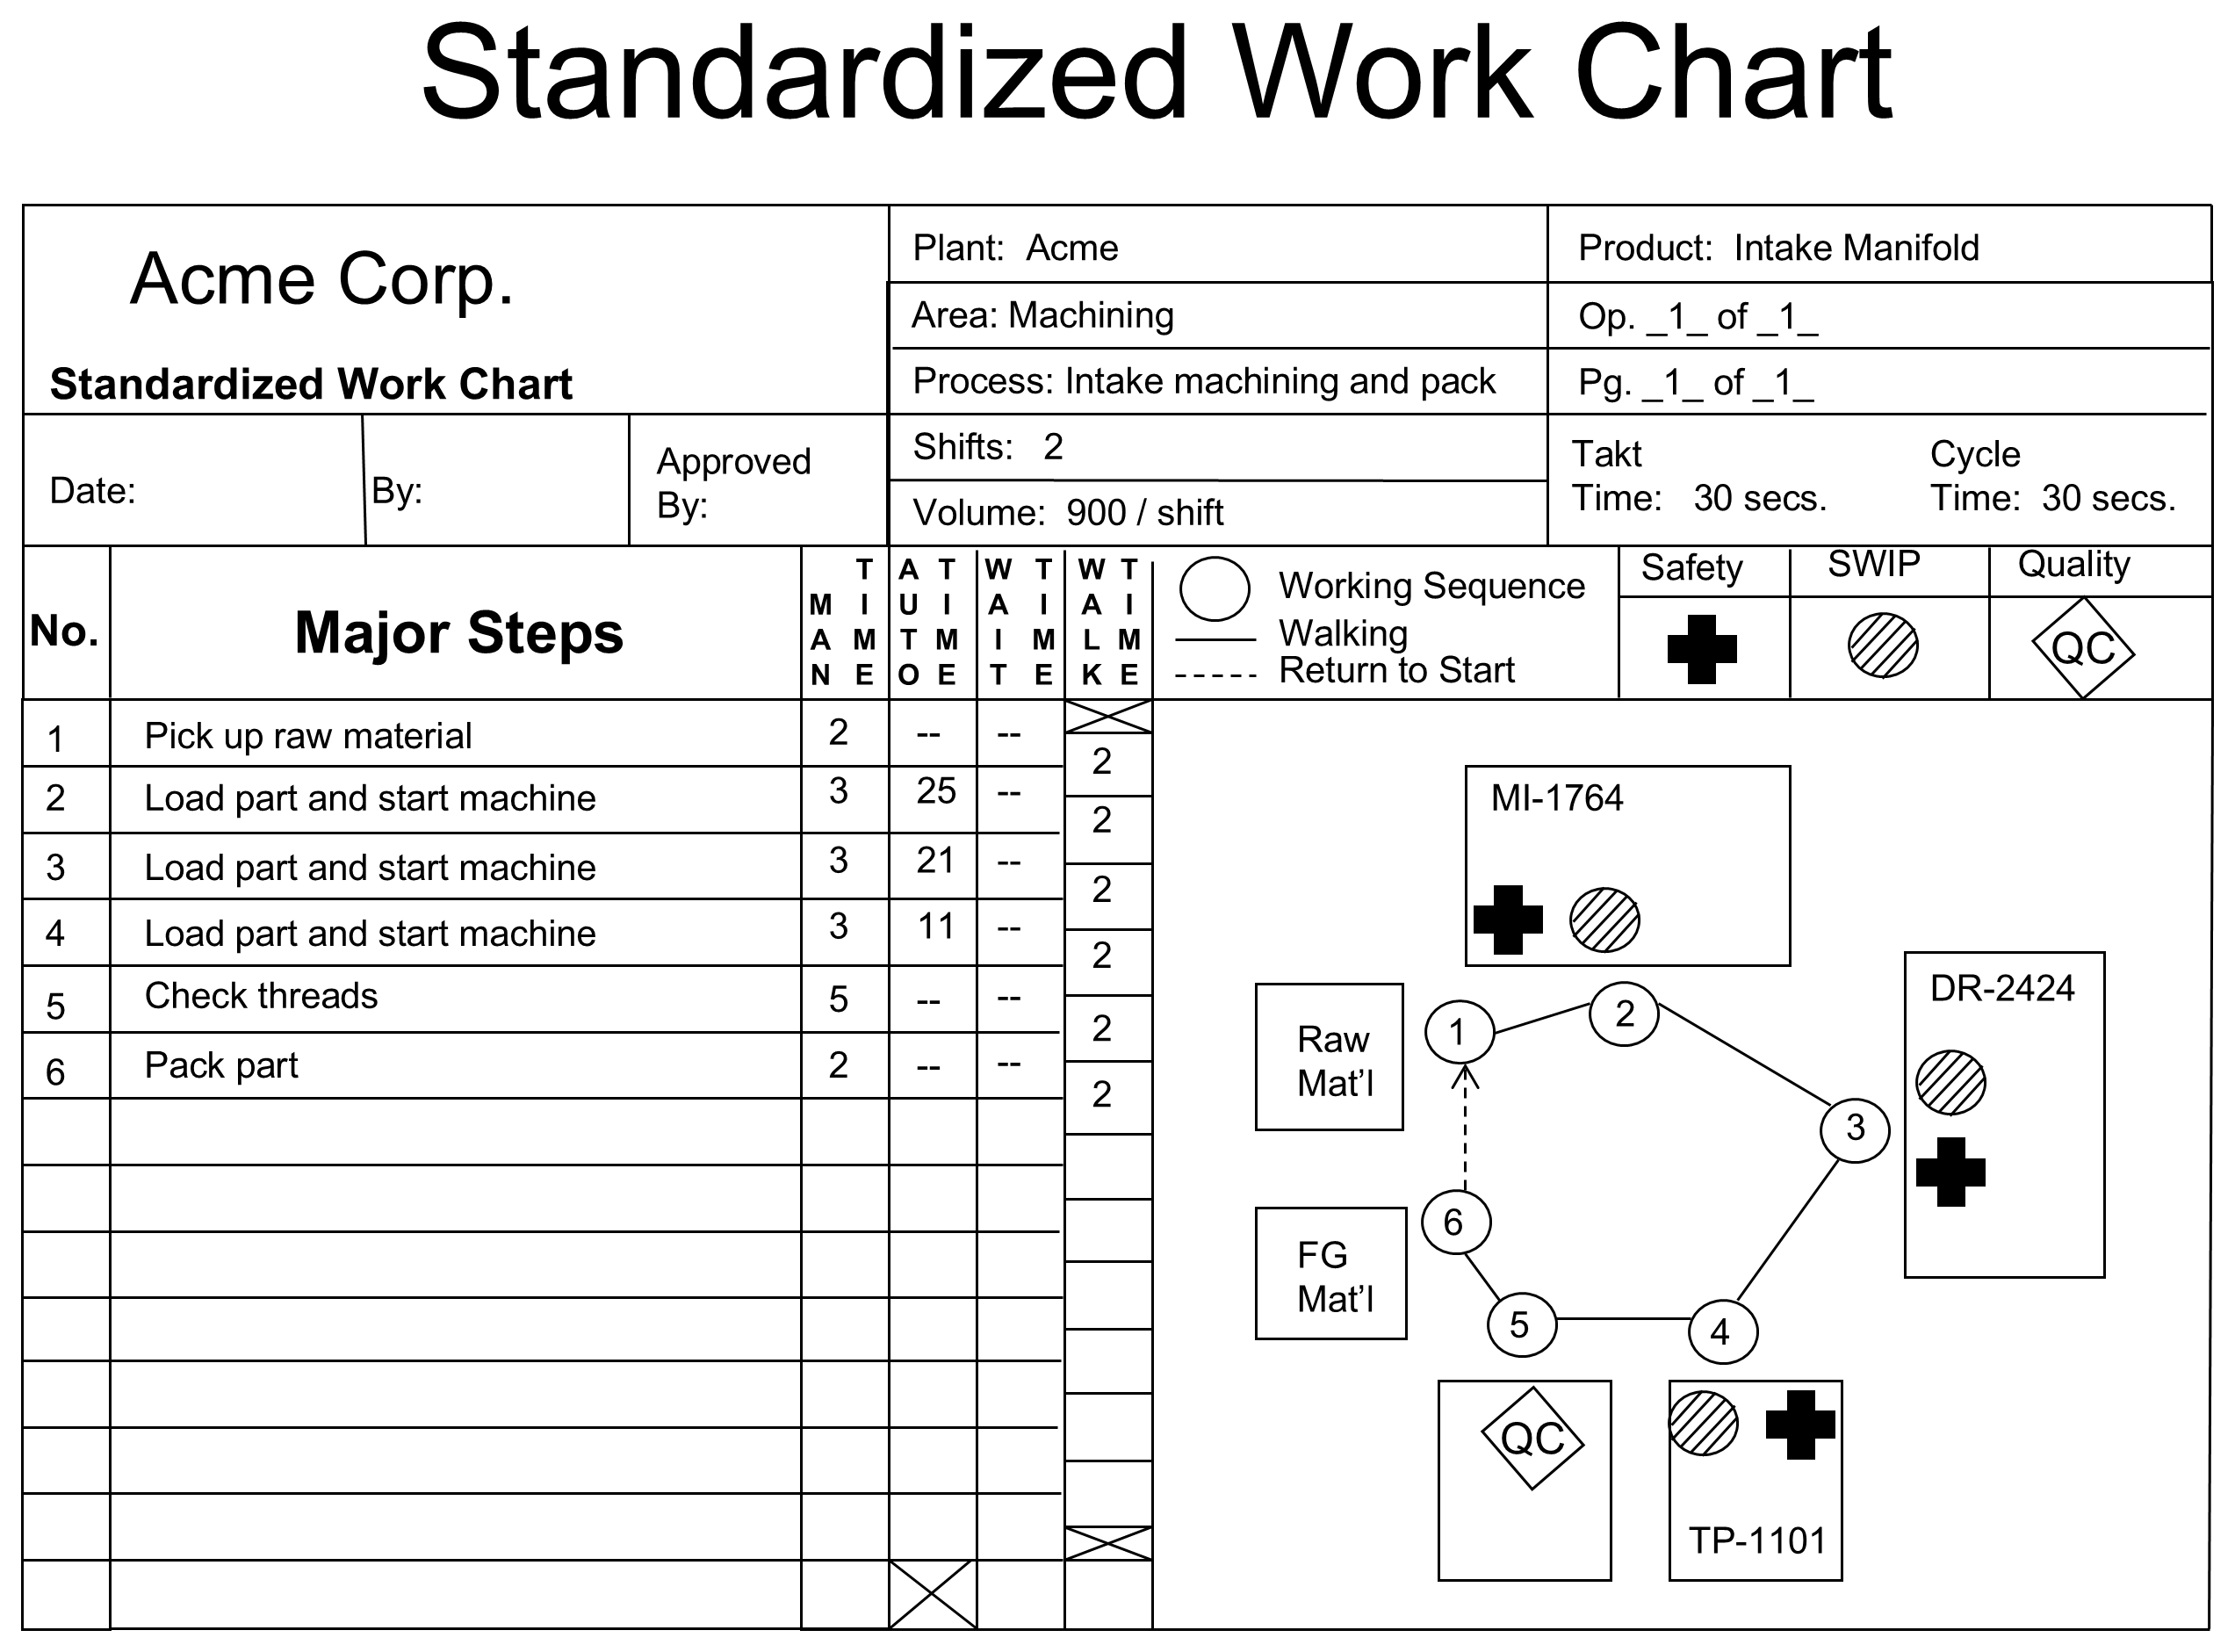
The original training form. The plan-view layout shows the cell, the numbered 1 → 6 work sequence with its return path, and the SWIP, quality, and safety symbols placed where they apply.
What to notice: the chart ties the sequence to the physical layout. Walking, SWIP, and check points are shown where they actually occur — not as a generic list.
5How the chart is filled in
The chart is completed in a consistent order, drawing on the forms that come before it:
- Copy area, process, plant, and product from the Combination Table.
- Enter takt time, and the cycle time (manual + walking + waiting) for the team member.
- Draw the work-area layout — machines, tables, pallets — roughly to scale, with machine numbers, hatching the least-capable machine.
- Number the work sequence on the layout; connect it with a solid line, and show the return with a dashed arrow.
- List the major operational steps with their manual, automatic, wait, and walk times.
- Mark standard work-in-process where pieces come to rest, with “× n” for more than one.
- Add quality-check and safety symbols where they apply.
- Have the team leader and manufacturing engineer review, sign, and date it.
6How leaders use the chart
Posted at the work area, the chart turns into a daily management tool. A leader at the gemba uses it to ask:
Posting the chart does not mean standardized work is being managed. The chart only has value when a leader actually compares it with the work at the gemba.
7Posting and keeping it current
Because the chart is a visual control tool, it is posted in the process — near the first operation of the work area, in a spot where it can be seen easily from outside the line.
When the method changes, the chart must change. If takt time changes, staffing and work allocation may need to be rechecked. A chart that no longer matches the work loses its authority as a standard — which is why revision discipline, and the team-leader and engineering approvals on the form, matter as much as the original drawing.
Section summary
The Standardized Work Chart is the posted, gemba-facing form. It maps the work sequence, SWIP, quality, and safety onto the actual layout, against takt and cycle time.
It is built last, from the observation, capacity, and combination analysis that precede it — and it only delivers value when leaders use it to compare standard with actual, and keep it current as the work improves.