Worked Examples
A3 Reports
Full-length practical problem-solving reports built as experiments in AI-assisted drafting and depiction. The latest is an interactive quality case with a 3D part model. Two are Toyota machine-shop cases. Two apply the same approach to well-documented NASA accidents.
With the advent of AI I am very interested in how problem solving will evolve. AI coaching and review of problem-solving content is already possible. AI assistance in drafting reports is also becoming common. That does not mean AI authoring the report. It means AI assistance in writing the report and in using HTML, SVG, and other tools to render displays of information. This was always possible with high-end graphics packages and 3D CAD systems. Now it is possible with LLMs and related tools.
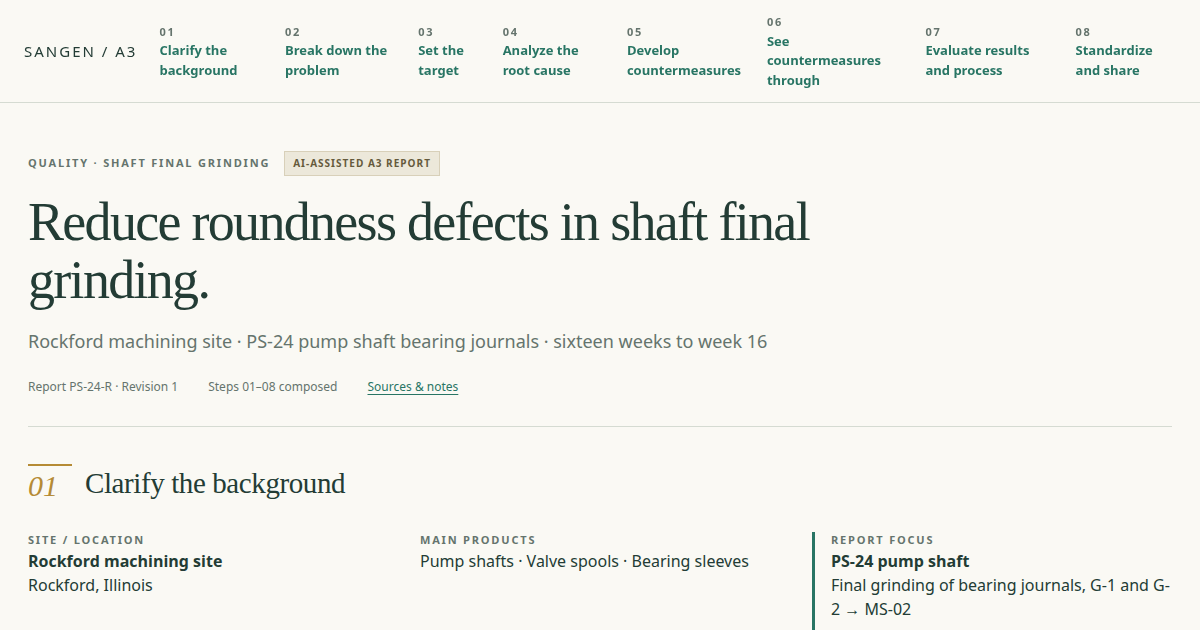
From time to time I will post A3 reports here that experiment with AI tools for depiction. Each one works from documented source material. The machine-shop scrap case is restored from the original in A3 Thinking. The Ohno 5-Why case is a historical recreation drawn from several sources, including Ohno's book and Toyota personnel. The Apollo 13 and Challenger cases are built from the official NASA investigation records. The roundness case uses synthetic example data. Where a detail is reconstructed for teaching purposes, the report says so. The Apollo 13 introduction page explains the first experiment in more detail.
Some predictions
AI will increasingly be used to generate A3 report content. Some of it will be poor: one-shot images produced by distillation, suitable for social media and not much else. Other changes will be for the better.
- Format. We will see more use of the vertical, scrolling format alongside the traditional horizontal A3 sheet.
- Quantitative displays. There will be better ways to create visual displays of quantitative information.
- Depth on demand. Hyperlinks let a report embed supporting information that the reader clicks only when more depth is needed.
- Interactive data. The reader hovers a Pareto bar or a point on a control chart and sees the underlying numbers, or filters the data by shift, machine, or date.
- Animation and simulation. Process flow, spaghetti diagrams, and changeover sequences shown in motion rather than as arrows on a drawing.
- 3D depictions. Parts, fixtures, tooling, and layouts can be shown as 3D objects the reader can rotate and inspect, rather than a flat sketch or photo.
- Video. AI video editing is already possible. Embedding video in reports, for example to show details at the genba, will eventually become regular practice.
- AI-checkable logic. If the report is structured data as well as prose, AI review can check whether the problem statement, the cause chain, and the countermeasures actually connect.
- Instant translation. The same report in Japanese and English for plants on both sides. AI translation is already good enough for this.
Toyota machine-shop cases
One restored from a published book case and one reconstructed from a well-known Toyota teaching story.
Machine type · 4M cause-and-effect
Reducing Scrap in the Machine Shop
Grinding process, shaft roundness defect, 2006
Restored and expanded from the machine-shop case in A3 Thinking (2008). The book shrank the A3 to a single-level fishbone; this version restores the multi-level 4M cause-and-effect analysis. Shaft-roundness scrap goes from 8.7% to under 2%.
Read the report →Historical reconstruction · 5-Why in full context
Ohno's Machine Stoppage 5-Why
Engine block machining shop, Toyota, early 1960s
Taiichi Ohno's famous 5-Why example placed back inside the full problem-solving framework it lived in. A historical recreation drawn from several sources, including Ohno's book and Toyota personnel. The machine number and incident date are reconstructed for teaching and labeled as such.
Read the report →Historical cases from the public record
The same problem-solving format applied to two accidents with extensive official investigation records. Chosen because the facts are established and checkable.
Public-record case · full report
Apollo 13 Oxygen Tank Failure
NASA, April 1970
The Apollo 13 oxygen tank failure written up as a Toyota-style practical problem-solving report. Every fact comes from the official NASA investigation and the public record; nothing is invented.
Read the report →Public-record case · technical and organizational causes
Space Shuttle Challenger O-Ring Failure
NASA, January 1986
The Challenger accident as a root cause analysis of the solid rocket booster field-joint O-ring failure, including the organizational decisions that let the launch proceed below the design temperature.
Read the report →