What Are the Seven Wastes in the Toyota Production System?
The seven wastes in the Toyota Production System are overproduction, waiting, transportation, processing, inventory, motion, and defects. Toyota uses the Japanese term muda (ムダ) for waste. These seven categories are the standard framework Toyota uses to identify and eliminate non-value-added activity on the production floor.
What most sources do not explain is where the seven categories came from. Five of the seven trace directly to Industrial Engineering process analysis — specifically, the five activity classifications in the ASME Standard for Operation and Flow Process Charts, adopted in 1947. The remaining two are Toyota’s own additions. The seven wastes are not an arbitrary list. They have a traceable lineage in industrial engineering that predates Toyota’s production system.
- Overproduction — making more or earlier than the next process needs
- Waiting — idle time when the process does not advance
- Transportation — unnecessary movement of materials between processes
- Processing — operations beyond what is required to meet specifications
- Inventory — raw materials, work-in-process, or finished goods beyond what is immediately needed
- Motion — unnecessary movement by workers that does not advance the process
- Defects — producing items that require rework, repair, or scrap
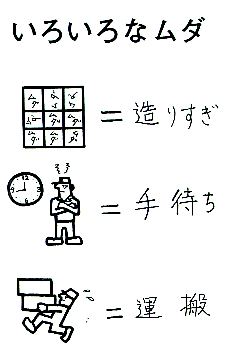
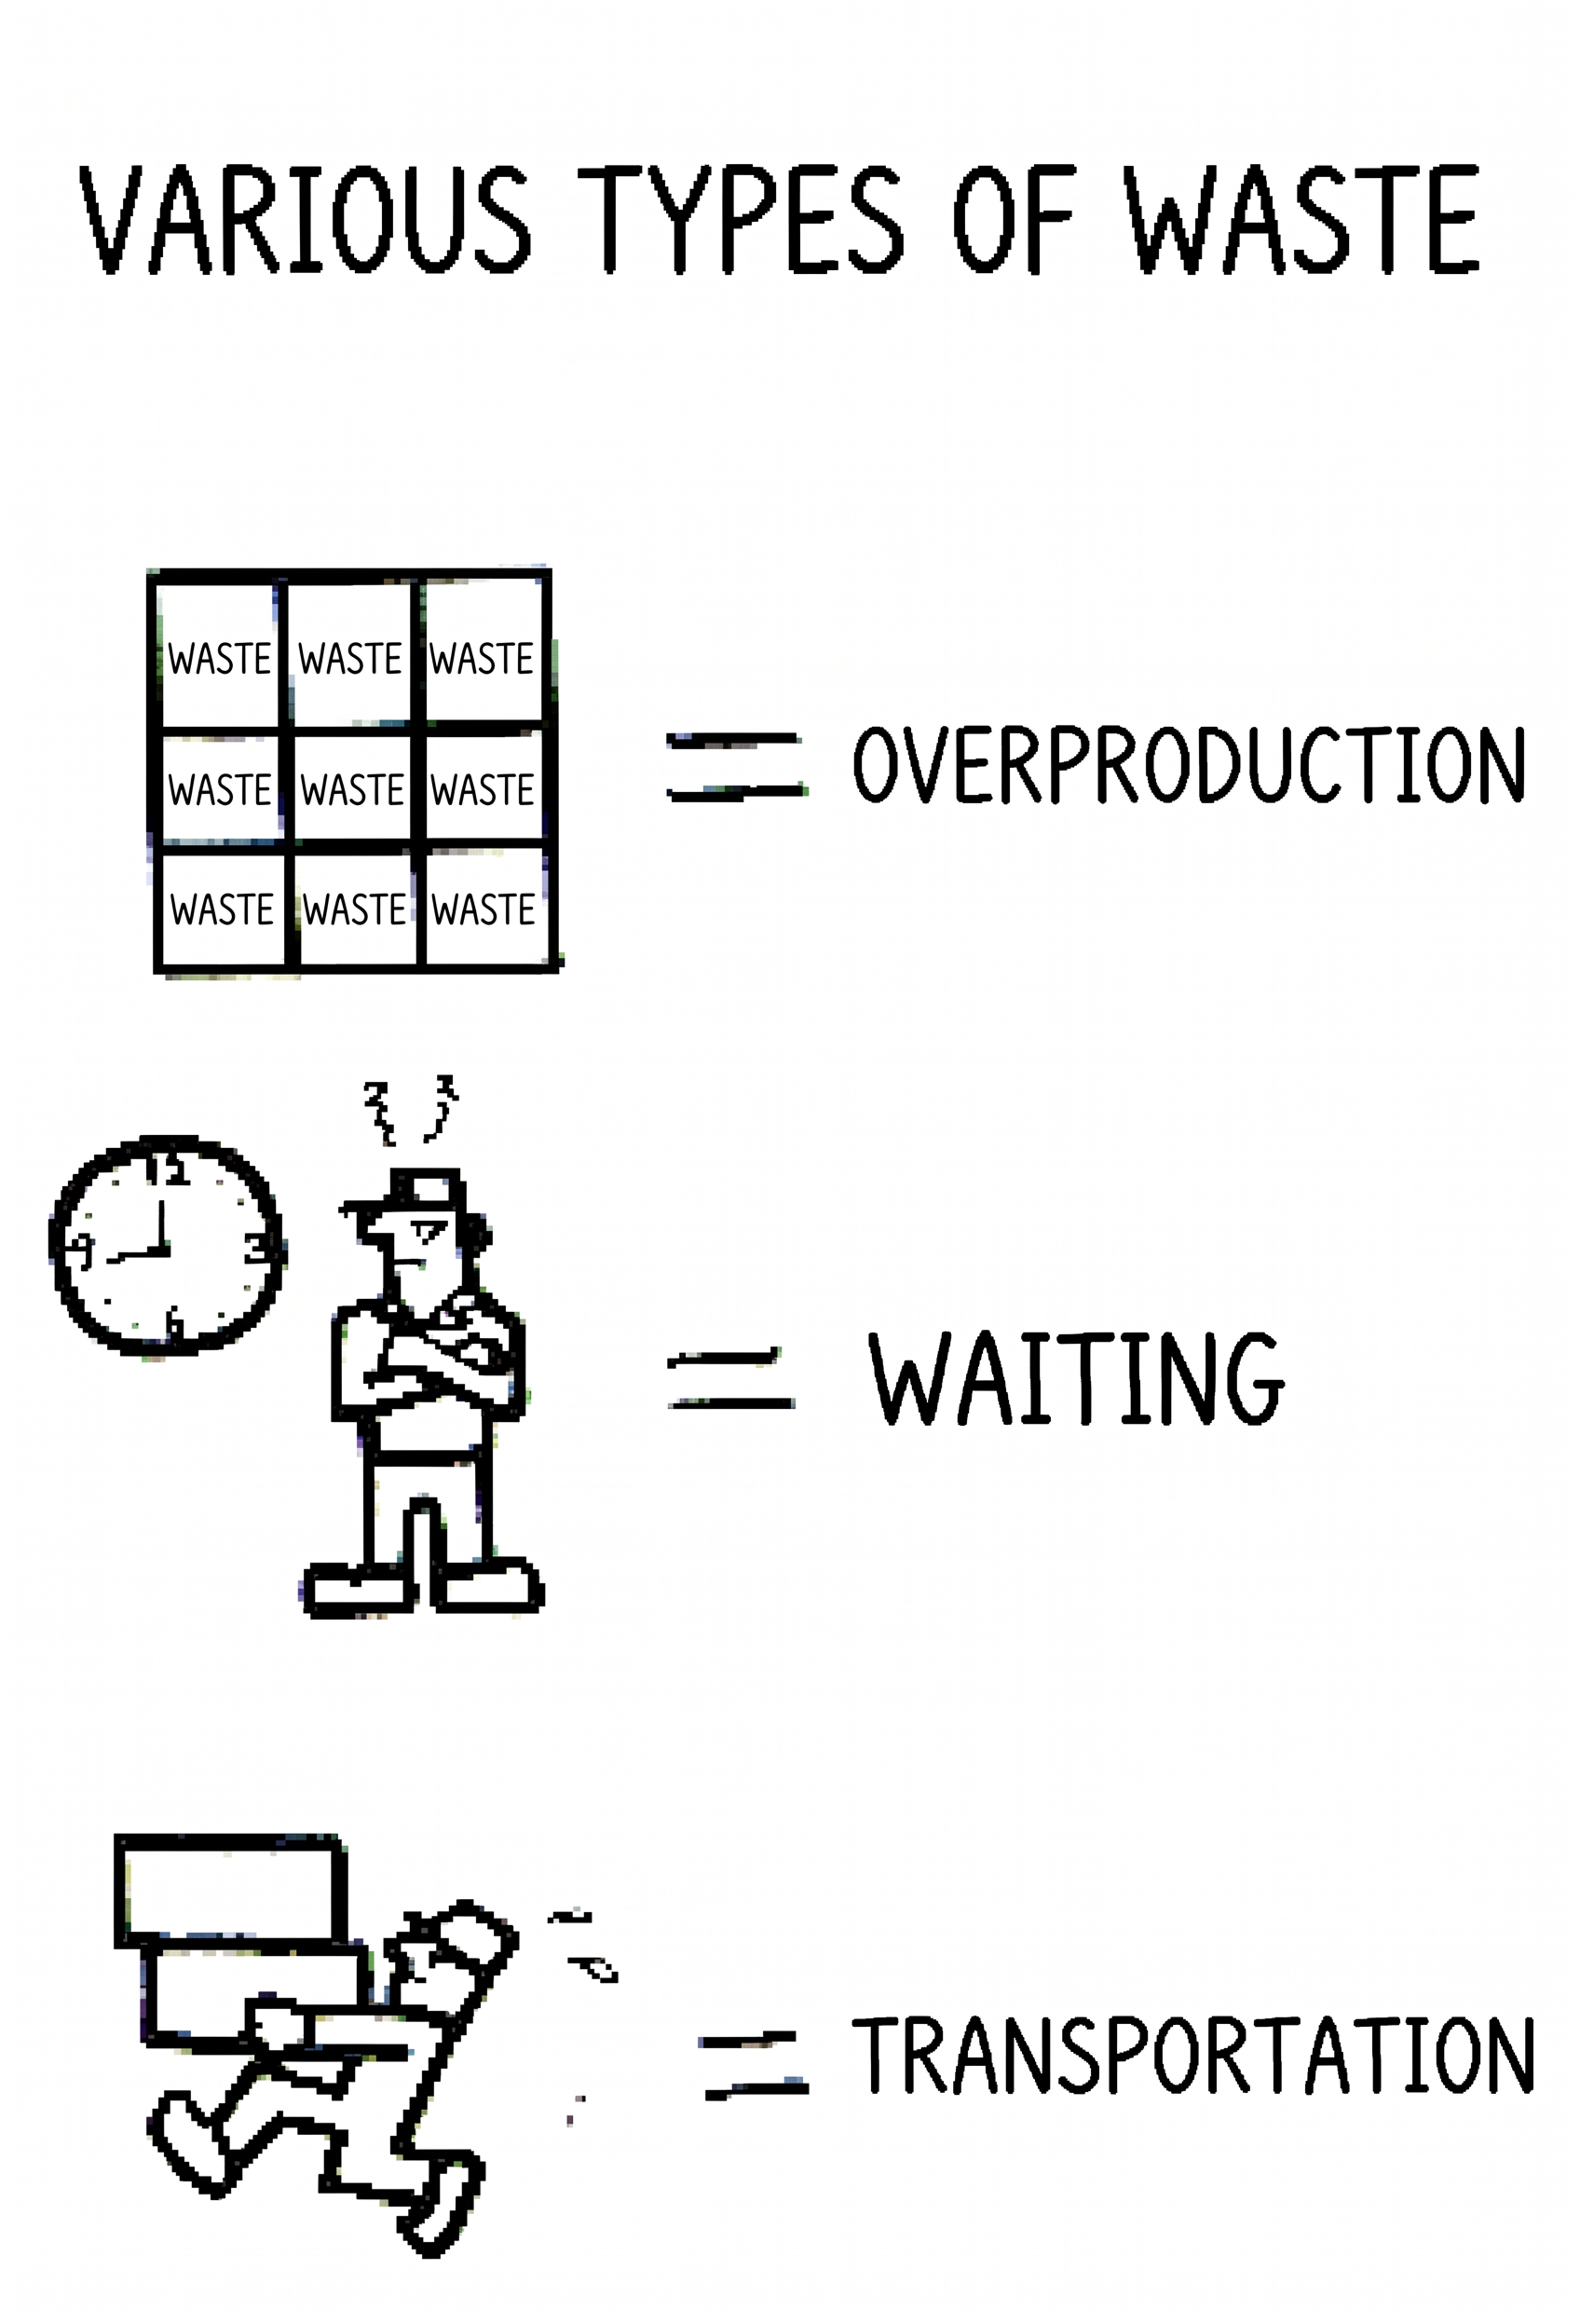
“いろいろなムダ” (Various Types of Waste) — from Toyota’s internal TPS training manual, with English translation. Three of the wastes illustrated: overproduction (excess parts in grid), waiting (worker standing idle by clock), and transportation (worker carrying materials).
Where did the seven waste categories come from?
The origin of the seven wastes is rarely discussed. Most lean sources attribute the list to Taiichi Ohno and leave it at that — as if Ohno invented the categories from scratch. He did not.
Five of the seven wastes map directly to the five activity classifications used in Industrial Engineering flow process charts. The American Society of Mechanical Engineers (ASME) standardized these five categories in 1947 under the “Standard for Operation and Flow Process Charts.” The five ASME process chart activities are:
- Operation (○) — an object is intentionally changed in its physical or chemical characteristics, assembled, or disassembled
- Transportation (⇒) — an object is moved from one place to another
- Inspection (□) — an object is examined or verified for quality or quantity
- Delay (D) — conditions do not permit the next planned action
- Storage (▽) — an object is kept and protected against unauthorized removal
These five categories were not new in 1947. They trace back to the work of Frank and Lillian Gilbreth and other early Industrial Engineers in the 1920s and 1930s. ASME formalized them into a standard that became the basis for process analysis worldwide — including in Japan, where Industrial Engineering methods were actively studied and adopted after World War II.
The mapping from ASME process chart symbols to Toyota’s waste categories is direct:
| ASME Symbol | ASME Activity | Toyota Waste |
|---|---|---|
| ○ | Operation | Processing waste |
| ⇒ | Transportation | Transportation waste |
| □ | Inspection | Defects |
| D | Delay | Waiting waste |
| ▽ | Storage | Inventory waste |
That accounts for five of the seven. The remaining two — overproduction and motion — are Toyota’s additions to the IE framework. Overproduction reflects Toyota’s particular emphasis on producing only what is needed, when it is needed. Motion reflects the distinction Toyota draws between a worker moving (動く, ugoku) and a worker working (働く, hataraku) — movement that does not advance the process is waste, even when the worker appears busy.

Five of seven wastes trace to ASME flow process chart symbols (1947). Overproduction and motion are Toyota’s additions beyond the IE standard.
How does TWI Job Methods connect to waste elimination?
The vocabulary of “elimination of waste” (ムダの排除) at Toyota has roots in Training Within Industry (TWI), the American wartime training program that Toyota adopted in 1951. TWI’s Job Methods (JM) course taught supervisors a structured approach to improving work methods using the ECRS framework: Eliminate unnecessary steps, Combine operations, Rearrange sequence, and Simplify the remaining work.
The ECRS questioning technique — asking “What is the purpose?” followed by “Why?” for each step of a process — appears directly in ASME process chart methodology as well. The flow process chart in the ASME standard includes columns for questioning each activity: What? Where? When? Who? How? — each followed by “Why?” The expected actions are: eliminate unnecessary activity, combine or change place, combine or change sequence, combine or change person, simplify or improve method.
Ohno stopped the formal TWI Job Methods program at Toyota after approximately two years because it lacked the time study component necessary for just-in-time production and standardized work. But the conceptual vocabulary of waste elimination — and the ECRS improvement logic — persisted. Isao Kato later reincorporated ECRS principles into Toyota’s internal Kaizen Training Course around 1967. The thread from IE process analysis through TWI Job Methods to Toyota’s waste framework is continuous, even though the specific programs changed.
Why is overproduction the worst waste?
Toyota considers overproduction the most serious of the seven wastes. This is widely repeated in lean literature, but the mechanism is rarely explained.
Overproduction triggers the other wastes. When a process produces more than the next process needs:
- Inventory accumulates — the excess must be stored somewhere
- Transportation increases — the excess must be moved to storage and later retrieved
- Waiting is hidden — the overproducing process looks busy, masking idle time that should be visible
- Defects are concealed — defective items sit in inventory rather than being caught immediately
- Processing may increase — additional handling, counting, and management of excess stock
- Motion increases — workers move around larger quantities, search through stock, manage space
Toyota’s internal TPS instruction manuals describe this cascade: overproduction “causes immeasurable other wastes beyond just the immediate process, and creates the illusion that people are working” (あたかも働いているかのように錯覚さえしてしまう). The word “illusion” is significant — overproduction makes waste look like work.
This is also why the training materials emphasize converting all waste into visible waiting. If a worker has nothing to do, that should be visible as idle time — not hidden by producing unnecessary parts. Standardized work, kanban, and other TPS mechanisms exist partly to make overproduction impossible, so that waste becomes visible as waiting, which is the easiest form of waste to see and address.
What is the relationship between muda, mura, and muri?
The seven wastes (muda) are not the complete picture. Toyota teaches three related concepts together:
- Muda (ムダ) — waste: activity that adds cost without adding value
- Mura (ムラ) — unevenness: variation in volume, mix, or pace that creates peaks and valleys
- Muri (ムリ) — overburden: pushing people or equipment beyond their capacity
These three form a causal chain. Mura (unevenness) is often the upstream cause. When production volume swings between peaks and valleys, the peaks create muri (overburden on people and machines) and the valleys create muda (idle resources, excess inventory from the peak). Heijunka — level production scheduling — is Toyota’s primary countermeasure for mura, which in turn reduces both muri and muda.
Most Western lean implementations focus on muda alone — hunting for the seven wastes as a checklist exercise. Toyota’s approach starts with mura. Leveling the production schedule eliminates a large category of waste without ever touching individual workstations.
What do most sources get wrong about the seven wastes?
They present the list as ahistorical. The seven wastes have a clear lineage in Industrial Engineering process analysis. Five of seven categories map to ASME flow process chart symbols standardized in 1947. Knowing this changes how you think about the list — it is a structured analytical framework, not a random collection of bad things.
They treat the list as timeless and self-evident. The seven wastes have roots in IE process analysis going back decades before Toyota. Presenting the list as if it appeared fully formed obscures the analytical framework behind it — and makes it harder to use effectively.
They add an “eighth waste.” Some Western lean authors add “unused human potential” or similar. Toyota does not recognize an eighth waste. The seven wastes are grounded in observable physical waste on the production floor — things you can see, time, and measure. Adding abstract organizational concepts changes the nature of the list. If underutilized human intellect counts, why not wasted energy, compressed air, or poor strategy? There is no logical stopping point.
They skip mura and muri. Treating the seven wastes as a standalone checklist, disconnected from unevenness and overburden, misses Toyota’s actual teaching. Waste is often a symptom. Unevenness is often the cause.
They assert overproduction is worst without explaining why. The mechanism matters: overproduction triggers every other waste category and creates the illusion that people are working productively. Without this explanation, “overproduction is the worst waste” is a slogan, not an insight.
The seven wastes in detail
1. Overproduction (造りすぎのムダ)
Making more than the next process needs, or making it earlier than needed. This includes producing ahead of schedule to build buffer stock, running a machine at capacity regardless of downstream demand, and continuing to work during what should be idle time.
Overproduction is the root waste because it triggers all other categories. The manual notes that it “creates the illusion of working” — a worker producing unnecessary parts looks productive, hiding the fact that true capacity is being wasted.
2. Waiting (手待ちのムダ)
Idle time when a worker cannot proceed because a machine is cycling, a prior process has not delivered, or there is nothing to do. Toyota considers waiting the most visible form of waste — and therefore the most useful. Toyota’s instruction manuals emphasize converting all other wastes into visible waiting, because waiting is easy to see and address.
The manual gives a specific example: three workers each standing at a machine, watching it cycle. By rearranging the work so one worker operates all three machines in sequence, two workers are freed — the waiting waste is eliminated.
3. Transportation (運搬のムダ)
Moving materials farther than necessary, or handling them more times than necessary. This includes transporting parts to and from intermediate storage, transferring between pallets, and moving materials through excessive distances due to poor layout.
Transportation waste is distinct from the transportation that is genuinely necessary to move material through the production process. The waste is in the excess — the extra moves, the temporary staging, the double-handling.
4. Processing (加工そのもののムダ)
Performing operations beyond what is required to meet the product specification. This includes using a more precise process than needed, applying unnecessary surface finishes, or performing extra steps because tooling or fixtures are inadequate.
Toyota training materials give a concrete example: a fixture with a defective guide pin forces the worker to hold the part by hand during processing, adding time and difficulty. Fixing the fixture eliminates the processing waste. This is characteristic of Toyota’s approach — processing waste is often an engineering problem, not a worker discipline problem.
5. Inventory (在庫のムダ)
Raw materials, work-in-process, or finished goods held beyond what is immediately needed for production. Excess inventory consumes space, requires handling and management, ties up capital, and conceals problems. Parts sitting in inventory may become obsolete, damaged, or lost.
Toyota’s view of inventory is not ideological. The goal is not zero inventory. The goal is right-sized inventory based on actual conditions — enough to support smooth production, not more. When conditions improve (shorter changeovers, more reliable equipment, better supplier delivery), inventory levels can be reduced further.
6. Motion (動作のムダ)
Unnecessary movement by workers that does not advance the process. Walking to retrieve a part that should be at hand, reaching across a workstation for a tool, turning to look at an instruction sheet mounted in the wrong location. Motion waste is about the worker’s body, not the product.
This category is one of Toyota’s additions beyond the ASME process chart framework. The ASME symbols classify what happens to the object (operation, transport, inspection, delay, storage). Motion waste classifies what happens to the worker — recognizing that a worker can be in constant motion without advancing the process at all.
7. Defects (不良をつくるムダ)
Producing items that do not meet specifications, requiring inspection, sorting, rework, repair, or scrapping. Defect waste includes not just the defective item itself but all the resources consumed in making it, detecting it, and dealing with it.
Toyota’s approach to defect waste goes beyond inspection. The jidoka principle — building quality into the process so that defects are detected and stopped at the source — is the countermeasure. The goal is to make it impossible to produce a defect and pass it downstream, rather than relying on inspection to catch defects after the fact.
Frequently asked questions
What are the 7 wastes of lean manufacturing? The seven wastes are overproduction, waiting, transportation, processing, inventory, motion, and defects. They originate from Toyota’s production system and are used to identify non-value-added activity on the production floor. Five of the seven trace to Industrial Engineering process analysis categories standardized by ASME in 1947.
Who created the seven wastes? The seven wastes are attributed to Taiichi Ohno, who led the development of the Toyota Production System. However, Ohno did not invent the categories from scratch. Five of the seven correspond to the five ASME flow process chart symbols used in Industrial Engineering since the 1920s-1940s. As a historical note, Toyota’s internal training manual discusses four of the seven in detail — overproduction, waiting, transportation, and processing — though the full list of seven was the established framework by the time TPS was widely taught.
Is there an eighth waste? Not in Toyota’s framework. Some Western lean authors add “unused human potential” or “unused talent” as an eighth waste. Toyota does not recognize this addition. The seven wastes are grounded in observable, measurable physical waste on the production floor. Adding abstract concepts like underutilized intellect changes the nature of the list and opens it to unlimited expansion.
What is the worst of the seven wastes? Overproduction. Toyota considers it the most serious because it triggers every other waste category — excess production creates inventory, requires transportation, conceals defects, hides waiting, and generates unnecessary motion and processing. The Toyota training materials note that overproduction “creates the illusion of working.”
What is the difference between muda, mura, and muri? Muda is waste (non-value-added activity). Mura is unevenness (variation in volume or pace). Muri is overburden (pushing beyond capacity). They form a causal chain: mura creates peaks that cause muri and valleys that cause muda. Toyota teaches all three together. Focusing on muda alone — which most Western lean implementations do — misses the upstream cause.
What is the ASME connection to the seven wastes? The ASME Standard for Operation and Flow Process Charts (1947) classifies all process activities into five categories: operation, transportation, inspection, delay, and storage. Five of Toyota’s seven wastes map directly to these categories: processing (operation), transportation (transportation), defects (inspection), waiting (delay), and inventory (storage). The remaining two — overproduction and motion — are Toyota’s additions.
Art Smalley is president of Art of Lean, Inc. This article draws on Toyota’s internal TPS instruction manuals (トヨタ生産方式, Toyota Motor Corporation Education Department), the ASME Standard for Operation and Flow Process Charts (1947), and firsthand experience within Toyota’s production system. AI was used in the editing of this article and production of graphics.